


Machine Vision Optics: MTF Charts and Curves |
In Part 1 and Part 2 of this series of blogs on machine vision optics, we covered a range of parameters that contribute to overall image quality.
In this week’s blog we will be continuing with machine vision optics, exploring optical theory and equipping you with the tools to choose the right lens for your machine vision system.
MTF: Optical Data that Matters
When choosing a camera, the EMVA 1288 standard is a helpful set of parameters to help determine the right camera for your application. While there is no such standard for lenses, there are options when evaluating the potential performance of a given machine vision lens.
Modulation Transfer Function, or MTF, is a calculation of the potential optical performance of a lens. MTF charts can give OEMs and End Users a better understanding of the kind of optical quality to expect from various lenses, and are incredibly vital references when studying, comparing and making a decision on a lens.
Modular Transfer Function combines the spatial frequency response of an imaging system or a component, and measures this alongside contrast to provide data that represents image quality at a given spatial frequency.
What Impacts MTF?
The three most important factors that affect system MTF are the lens, the camera, and illumination. The lens is going to have the most impact on getting the best out of your camera’s sensor (and vice versa), and maintaining a well-illuminated imaging environment will ensure the best optical results. It’s important to make sure you choose high quality parts for these three core system components, as the higher the standard of materials and manufacturing in your lens, camera and lights, the better the potential optical performance and image quality. While cables, frame grabbers, optical filters, and any other components in your machine vision system will have a marginal effect on system MTF, it’s still worth making sure they are high grade parts to contribute to overall system durability and futureproofing.
Optical parameters such as Working Distance (WD), as well as Wavelength, F#, and Aberrations all impact MTF, so it is important to be as detailed as possible and maintain control of these factors.
What is MTF?
So, what is Modular Transfer Function?
Modular Transfer Function can be regarded as the response to a periodic alternating (sine) wave pattern. It is fundamentally a way of measuring the quality of light transmission through the lens. If the lens is more repeatable, then the light transfer is better, and smaller areas of contrast can be seen more easily.
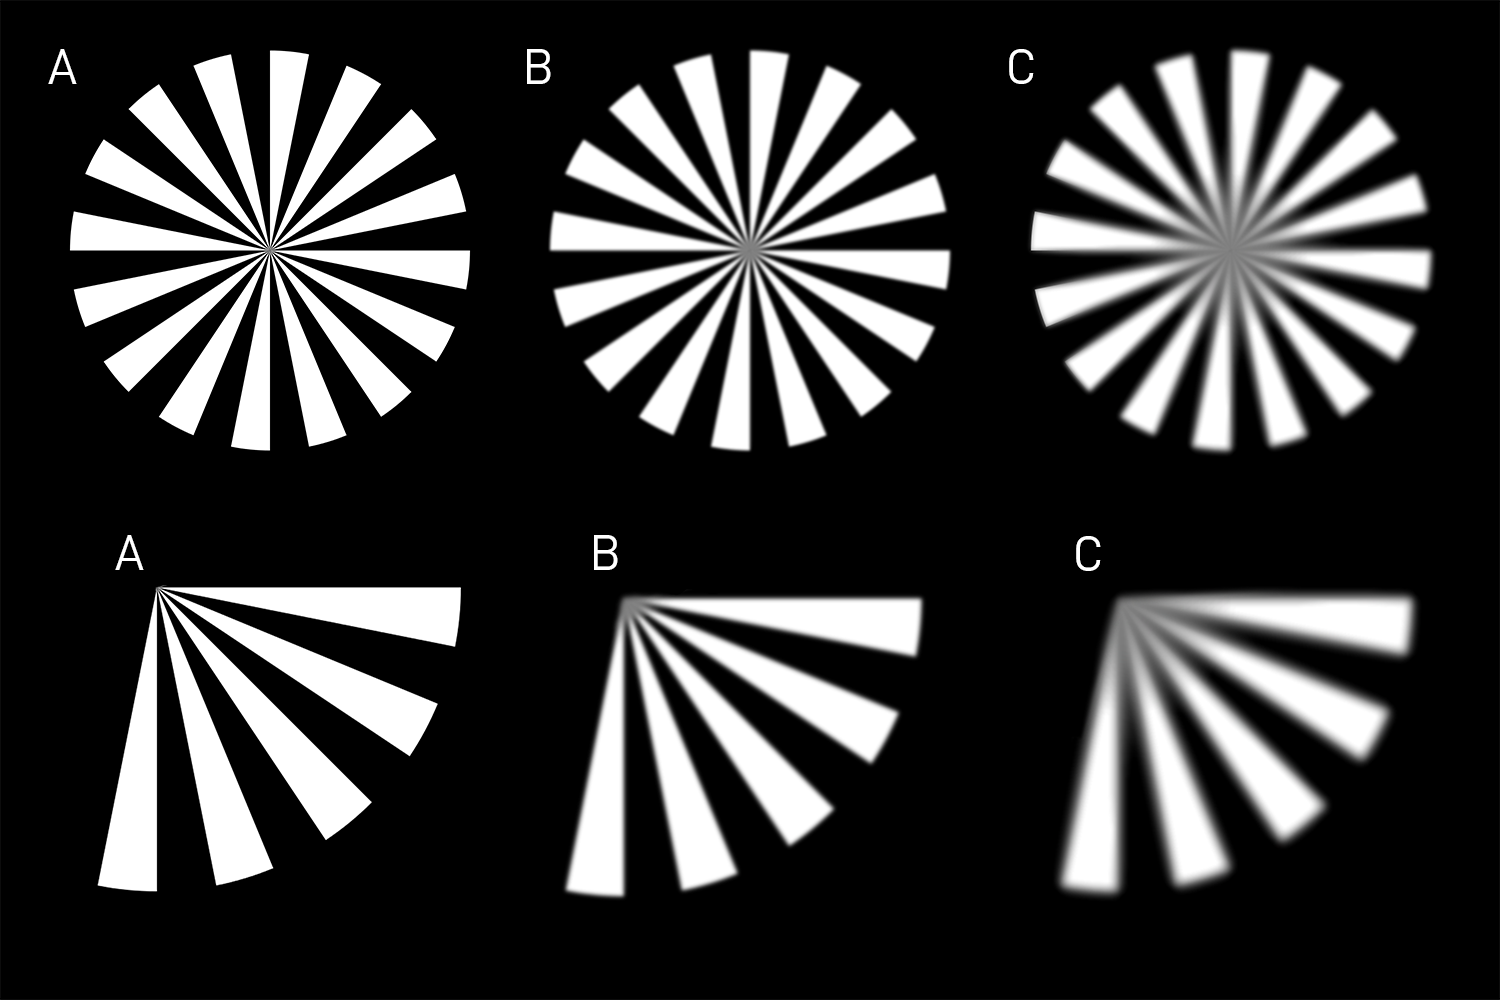
Siemen’s Star spoke targets are frequently used to test the image quality of lenses, sensors, printers and screens.
A clear example of this is in the above images. The Siemen’s star in ‘A’, ‘B’, and ‘C’ consists of light and dark spokes which shrink in size as they approach the centre of the image. There is far more detail present in ‘A’ than ‘B’ and ‘C’, because the lens used to capture ‘A’ is able to resolve a smaller area.
In ‘A’, the contrast is far better even in the smaller areas of detail. Frequently, MTF is specified in line pairs per millimetre (lp/mm); this is the frequency of the smallest resolvable contrasting areas, for example black and white lines, in the space of a millimetre.
A higher value of lp/mm will equate to a higher level of detail, contrast, and sharpness resolved by the lens. The higher this value, the higher quality the lens.
Due to the physics of how light is transmitted through a lens, MTF will be different in the centre compared with the outer areas of the lens. The physical nature of a lens means that light must be distorted as it passes through it in order to generate the required image.
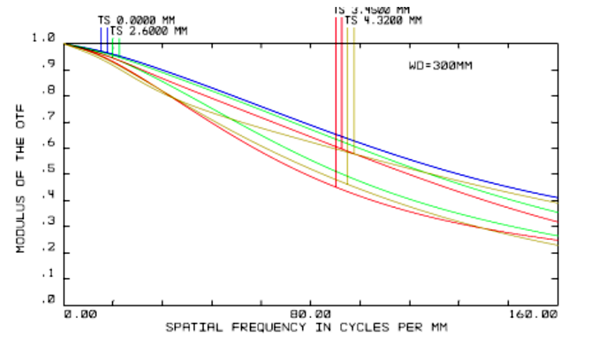
This is why many lens manufacturers tend to provide a chart (like the one above) displaying MTF at different points on the lens compared with the centre.
As you can see from the above chart, the y-axis is labelled modulus of the OTF, which is essentially a measure of contrast (%). The x-axis is labelled spatial frequency, which, in essence, is the same as lp/mm.
What each line on the chart then depicts is the rate of drop-off in contrast as the spatial frequency increases. This degradation in image quality is very common; no lens is perfect. The more elements the lens incorporates in its assembly, the more potential stages there are for contrast to depreciate as spatial frequency increases. For example, a zoom lens will typically have more elements than a lens with a fixed focal length, and will therefore most likely perform worse on an MTF chart in comparison (given that the lens specification remains the same for both).
Because MTF tends to vary at differing points along the curvature of the lens, multiple graphs reflecting image quality at various distances from the centre of the lens can be extremely useful, especially when large fields of view are in play.

To demonstrate this, here is image ‘A’ from earlier, taken with a lens that shows a steep decline in image quality as you get further away from the centre of the lens. This is a form of distortion known as Field Curvature – but more on that next week.
Helping You Make the Right Vision Decision
Stay tuned to this series of blogs as we continue to put the spotlight on optics, exploring aberrations, barrelling, distortion, and an ultimate guide to choosing the right lens.
Be sure to check our Lenses and Cameras pages for the best machine vision products on the market from industry leading brands such as Kowa, VST, Computar, Tamron, and Theia.

